Last year the Geospatial Commission launched a Call for Evidence to inform the development of the National Geospatial Strategy. Policy Lab worked with the Commission to support an open discussion of the evidence with the policy team and their partner bodies.
I joined Policy Lab as this project was starting, jumping across from a PhD in biochemistry into the world of policy making for a 3-month Open Innovation Team placement. Coming from a science background, I am used to data that can be directly quantified and clearly visualised. Our challenge for this project was working with evidence in the form of long written responses from 226 organisations, in particular visualising key themes and drawing connections between them.
Visually mapping evidence
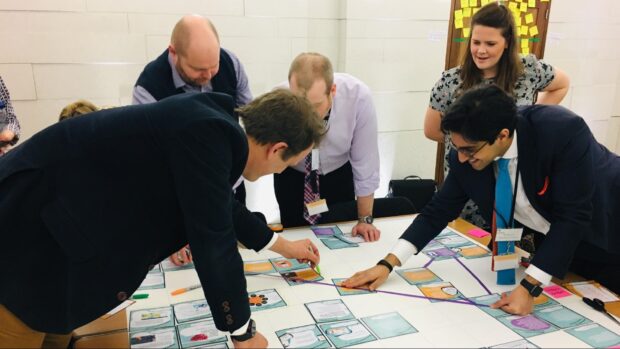
Policy Lab started the project with a ‘policy sprint’ for the Commission’s strategy team, focusing on drawing policy conclusions from the information received in the Call for Evidence. We created a blank canvas for the team, providing space for each participant to individually pick their top five pieces of evidence. We prototyped a visual mapping technique to allow the group to collaboratively organise the evidence and highlight key themes as they emerged. This experiment was successful in building a collective understanding of the main challenges for the project.
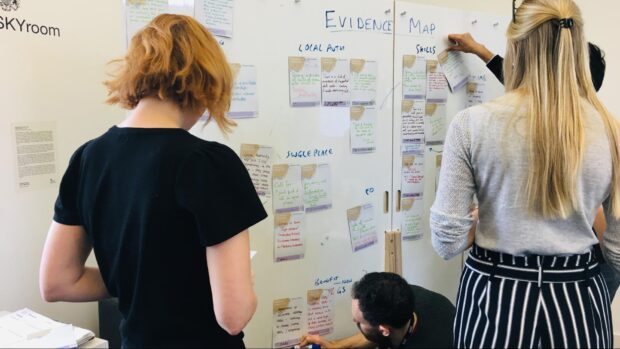
At a second workshop, we gathered a broader range of perspectives on the evidence, including the Geospatial Commission’s partner bodies. We further developed the prototype mapping technique, this time creating large participatory ‘evidence maps’ for attendees to work through. As we have written about elsewhere, interactive approaches and co-design generally result in better engagement with evidence and data. Our objective was to allow stakeholders to first visualise all the evidence, and then create a shared understanding of the most important issues.
Alternative cartographies
We used our ‘evidence card’ technique to tangibly highlight important types of data from the Call for Evidence. We presented individual pieces of evidence from the Call on the cards, and allowed participants to explore different ways of grouping and organising the evidence. We provided ‘unchartered maps’ (white sheets with pale blue gridlines) and all the stationary essentials, but left the groups to create evidence maps in whichever way they wanted.
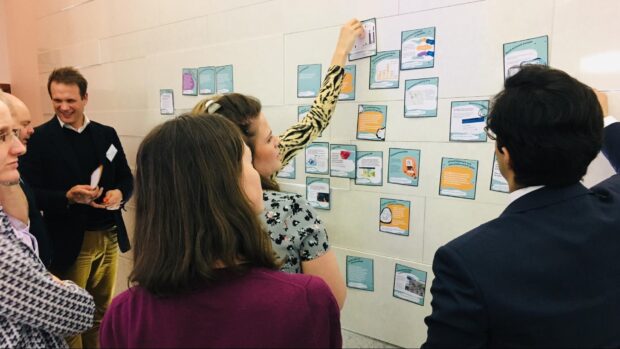
At first the three maps appeared very different. One group created a mind map with a network of connections showing how different types of evidence related. Another created a conceptual cartography, with ‘evidence islands’, continents and ravines. Closer inspection revealed that certain themes - geospatial skills, the role of standards, data quality, the question of a single point of access to geospatial data - were common to each map. It was significant to see that although the route was different for each group, they arrived at a similar destination.
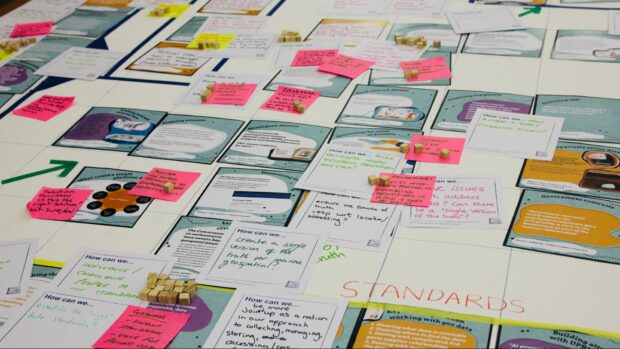
We used the evidence maps as prompts to explore challenges for the geospatial community. Challenge cards were laid on the map where they related to key pieces of evidence. We then used the challenges as a basis for suggestions for interventions, which were also added to the maps. This method of overlaying challenges and then intervention on top of evidence, created a visible link between each stage, making it easy to trace the origin of each suggestion back to the supporting evidence.
Learning from the experiment
This method of collaborative mapping is a great enabler of discussions. It lets each participant see how others view the connections between different issues. It leads to the creation of a shared understanding of the evidence that might not have been produced if each person had made their own map. These evidence maps can work for all kinds of projects and different purposes. It can also work with minimum prior planning, as in or our first workshop, or involve a more curated set of evidence, as in our second.
I am now looking forward to creating some maps of my own when I am back working on my PhD. I hope you also feel encouraged to create your own evidence maps. We are interested to see what different kinds of maps you create so please send us any images of your creations.
This blog is by Ben Dorgan, PhD Candidate, King's College London