I’m off to speak at Open Data Manchester this evening about both how open data and open working can make better policy. I thought I’d share some of the tools we in Policy Lab use to help us think through how data can help us understand more about the problems we are trying to solve.
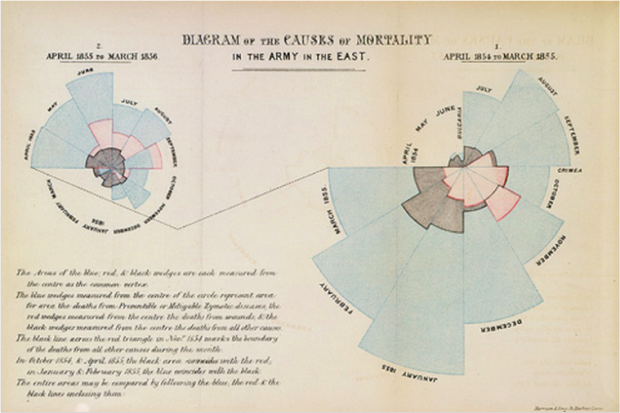
Data can do amazing things. Basic visualisation has been used for ages to uncover patterns and to create better policy responses. For example, in 1854 John Snow’s mapping of cases of cholera around Soho showed that they were all clustered around the Broad Street pub, and therefore revealed the source of the deadly disease. In the same decade, Florence Nightingale began using polar charts to plot different causes of deaths in the Crimean War, revealing that the majority were due to preventable cases and led to a change in nursing practices.
Over 160 years later, government is continuing this tradition with increasingly powerful computers and new forms of data. The GDS data team is part of the Government Data Science Partnership which aims to promote data science within government. Data science combines maths and computers to find answers in huge, complex and real-time data sets. And much of this data is openly available. For example, COBR (the government’s emergency committee) has developed a flood alert system, the Food Standards Agency has used Twitter data to detect Norovirus outbreaks, and the ONS is exploring how they can scrape prices from supermarket websites to feed through to economic outputs and how geo-located Twitter could provide new insights into population mobility.
In Policy Lab we've been using data science as part of our projects, which we conduct in as open a way as possible: bringing in stakeholders and users to help us understand the problem and develop solutions. In our Health and Work project (which looked at how we could support people to manage their health conditions and stay or thrive in work), we worked with Mastodon C and used the openly available Understanding Society survey.
Normally, we would have picked some variables we thought might correlate and run regression analysis to see how they related to each other. But using data science allowed a computer to correlate thousands of variables very quickly (a human would have been there for days). This confirmed some our expectations of risk factors, but also came up with some surprises (for example, bereavement in men showed as a particular risk factor). We were also able to use a segmentation technique to group similar people (all de-identified I should add) who had said they were on health-related benefits. This allowed us to see a) how two segments of people saying they were on health benefits had moderately good health and therefore required a different non-health intervention and b) how these two clusters were very different (one group was older men with previously well paid jobs, the other was younger men with previously low paid work) and would themselves require different types of interventions.
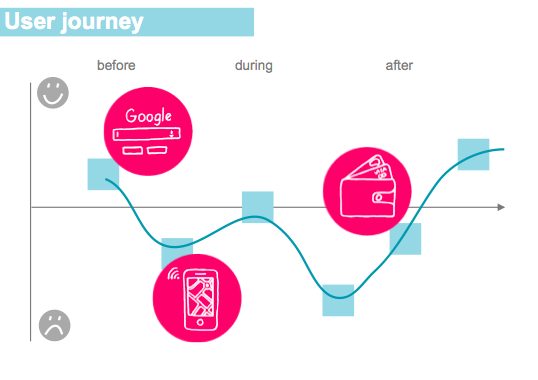
Since then we've been working on tools to help policymakers imagine what sort of data - not just traditional data - could be used to uncover more insights about their policies. We normally use user journeys to get people to put themselves in users’ shoes and get them to think about how they interact with services. Now we give them a set of data cards with different types of data on and think about how people might generate these along their journey. We looked at sensor data, social media data, Google search data, surveys, administrative data, geo-location data: in other words, types of data that policymakers might traditionally use, and others that they might not.
For more advanced data scientists and policymakers there are other sets of data cards giving them inspiration for how data has been used elsewhere and prompting them to think about the methods they could use. And finally, a set of cards promoting them to think about how to use data appropriately, so we work in a way that is open and acceptable.
If you wanted to find out about or try more of the above, there are two things you could do: come to our Data Science session on 12 May from 1pm - 2pm at the Cabinet Office (contact naeema.malik@cabinetoffice.gov.uk), and go to the OPM toolkit and download these tools. Try them yourself and tell us how you get on - they are a work in progress, so we’d appreciate your feedback!
1 comment
Comment by Rohan posted on
Whilst I agree with the sentiment here I do wonder if we should as a community be more overt about the limitations and risks in this area of work?
So as an example for a household panel survey - when doing segmentation in 2002 I would know self reporting of social security benefit receipt and income was misreported but in a seemingly random fashion as opposed to systematic misreporting in a predictable fashion. We all obviously live with that and look to dampen it (e.g. by comparing population level data with administrative data) - but if we're then doing large scale statistical / regression on top of that it matters to understand what's going on with the data beneath the variables. Obviously if it helps us formulate hypothesis it's fine but as per your (great) ethics framework the risks scale as you build more on the insight (up to and including potentially building segmented interventions).
Similarly with social media data recent changes to algorthyms seem to make it harder to use to understand behaviour across populations. And google flu is obviously a great example of the limitations of models and data.
None of this is to say this isn't a great area of discovery and a really helpful blog post - I was over with the stakeholder who runs services for citizens last week and my first thought was what we could use their web search/google analytics and case management data for to help our customers in government!