This two-part blog series describes a recent collaborative project between Policy Lab and the Department for Transport (DfT) which adopted a tactile and kinaesthetic approach to map the policy consultation process and considers a possible role for data science.
This blog series is for those with a curiosity for how the policy consultation process works and are interested in new ways of running consultations.
This first part outlines the context of the project and describes our design methodology, which included a kinaesthetic mapping approach and prototyping. The second part outlines our findings from the research, in particular the possible role that data science processes can play in the policy consultation process.
The role of consultation in open government
Consulting is a cornerstone of the public policy process in the UK. As of 28 October 2019 there are 4,969 results for open and closed policy consultations on the relevant gov.uk webpage, ranging from the door closure warning time on London Underground trains to legislation on drones. Consultations are an essential ingredient for open government, allowing government to access a wide range of information to improve the quality of decisions reached, and alerting policy makers to issues not picked up through existing evidence or research.
However, anecdotal evidence suggests that the process can be improved. This has already been recognised in the government’s response to the Secondary Legislation Scrutiny Committee, which includes the commitment to “reduce the risk of ‘consultation fatigue’ by making sure we consult only on issues that are genuinely undecided”.
Data science in policy consultations
DfT had already developed a consultation tool with data science processes, but this was built for one particular consultation. Our project brief was to develop the existing tool, including data science processes like ‘sentiment analysis’ and ‘topic modelling’, into something that would be available to policy makers across all consultations. We approached this by developing an interactive and tactile mapping process, co-diagnosing the initial challenge with policy makers, and then co-designing solutions with a mix of policy makers and analysts.
The lived experience of policy makers
Before exploring the potential benefits of data science, we investigated the lived experience of policy makers as they organise, conduct and analyse public consultations. Mapping this process revealed ‘pain points’ where interventions, including data science, could have a significant impact.
This research started with a day-long workshop where DfT policy makers and communication experts shared their perspectives on policy consultations from inside and outside of government. Policy Lab facilitated the co-creation of an initial consultation ‘process map’ and ‘user journey’ using a participatory ‘journey mapping’ technique.
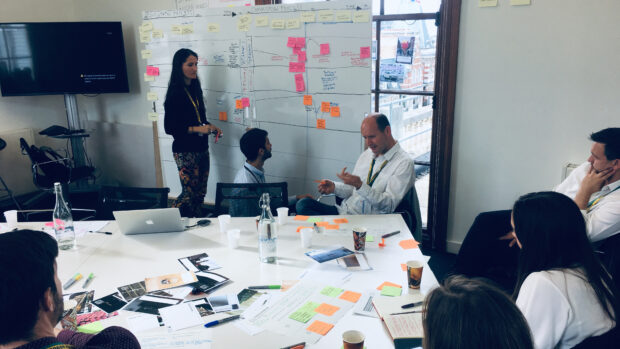
The next stage of the research was to capture broader and deeper insights by testing the consultation process map we had developed with a wider range of policy makers across Whitehall. It quickly became apparent that a conventional static process map would restrict analysis of the variation in consultation processes between departments and even within departments.
This challenge prompted a creative response from our team: a physical, modular policy consultation map allowing users to adapt and add to the stages identified in the initial workshop.
Meaning-making through kinaesthetic learning and touch
Policy Lab has been developing tactile and experiential approaches to problem solving in a number of projects. Becky Miller has previously written about ‘learning-by-doing’ in our work on the Maritime 2050 Strategy, whilst kinaesthetic learning is at the heart of the evidence safari approach we have used on a number of projects, including the future of an ageing population.
Our experimentation in kinaesthetic and haptic modes of research is grounded in evolving academic literature. It has deepest roots in the fields of education and learning where authors including Neil Fleming categorised learning styles as visual, aural/auditory, read/write and kinaesthetic. The psychologist Howard Gardner has gone further, arguing that humans possess multiple intelligences which include linguistic intelligence, musical intelligence, logical-mathematical intelligence and bodily-kinaesthetic intelligence, although his theory not been validated empirically.
More recently researchers in the higher education and museum studies fields have explored how tactile engagement with objects can contribute to knowledge acquisition and processing in unique ways, not least because touch is experienced via areas of the brain that deal with emotion, motivation and memory.
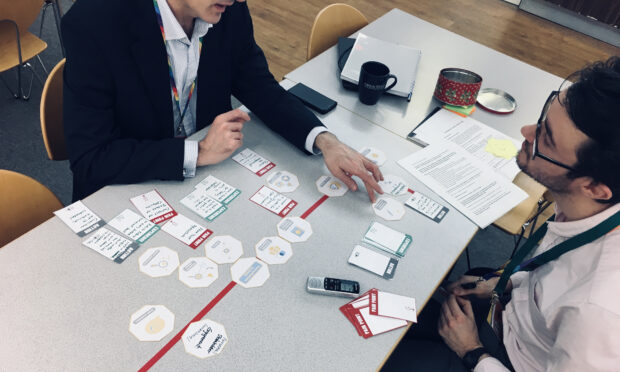
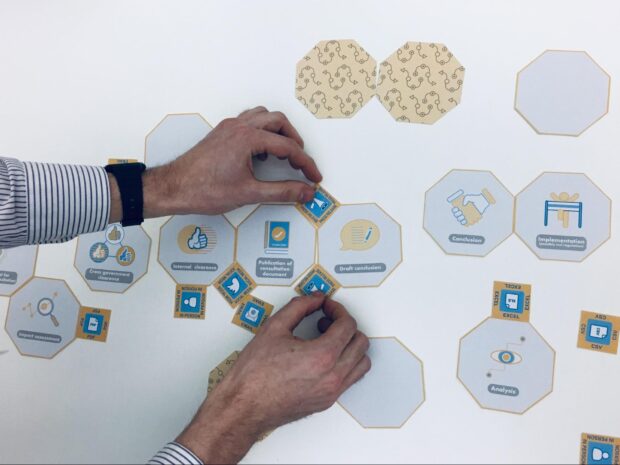
Informed by these insights from pedagogy, neuroscience, museum studies and our own experience, we deployed our physical consultation map in research interviews. These interviews were with civil servants that had been involved in different stages of the consultation process, covering a range of roles and departments, including policy making, project management and digital communication.
The map incorporated a board game aesthetic, encouraging challenge and movement from those interviewed. Its visual aspect allowed interviewees to see the consultation process as a whole rather than list of tasks, and the maps tactility pushed them to explore their experiences in unusual ways. For example, the simple task of physically moving stages around a journey map prompted interviewees to think in a non-linear way and allowed them more freedom in describing their typical experiences of consultations.
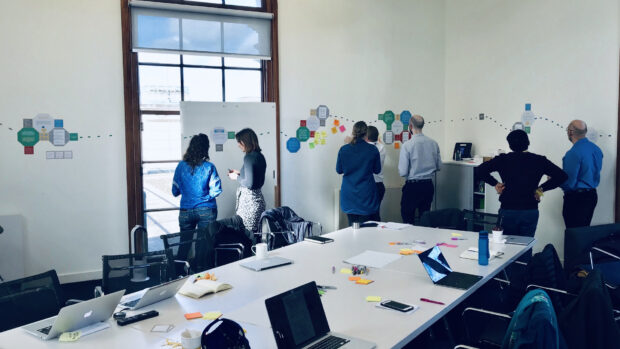
We translated our findings into higher level insights to share with analysts from a range of departments. Again we used a kinaesthetic approach, creating a physical ‘journey’ through the research insights on the walls of the room, where the analysts were also invited to add their comments (see image above).
One of the motivations of this approach was to bring in different, less-frequently used learning styles to the policy-making process, where the written document traditionally holds sway. Unfortunately we were not able to test whether this approach was fully accessible, including to those with mobility or visual impairments. This is where we need to go as a Lab, and we are actively addressing it in our current projects.
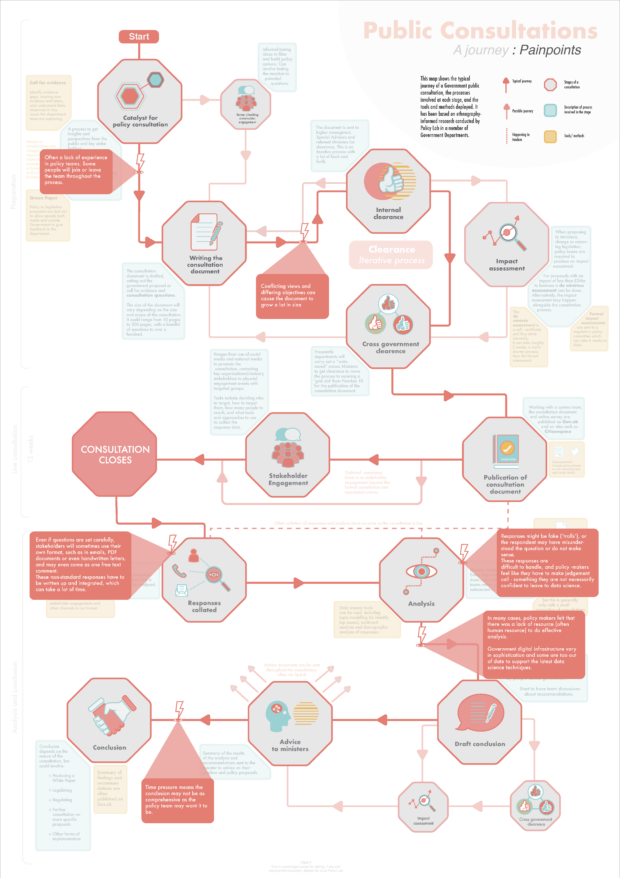
A map of the policy consultation process - and ‘pain points’
From this research we developed a visual map of the stages involved in a policy consultation. The map shows what our research indicates is the typical consultation journey, but also some of the alternative routes that interviewees cited. At each stage of the consultation, the map shows processes, experiences and tools typically encountered, as well as ‘pain points’ where processes cause problems and inefficiencies (see image below for a map highlighting these pain points).
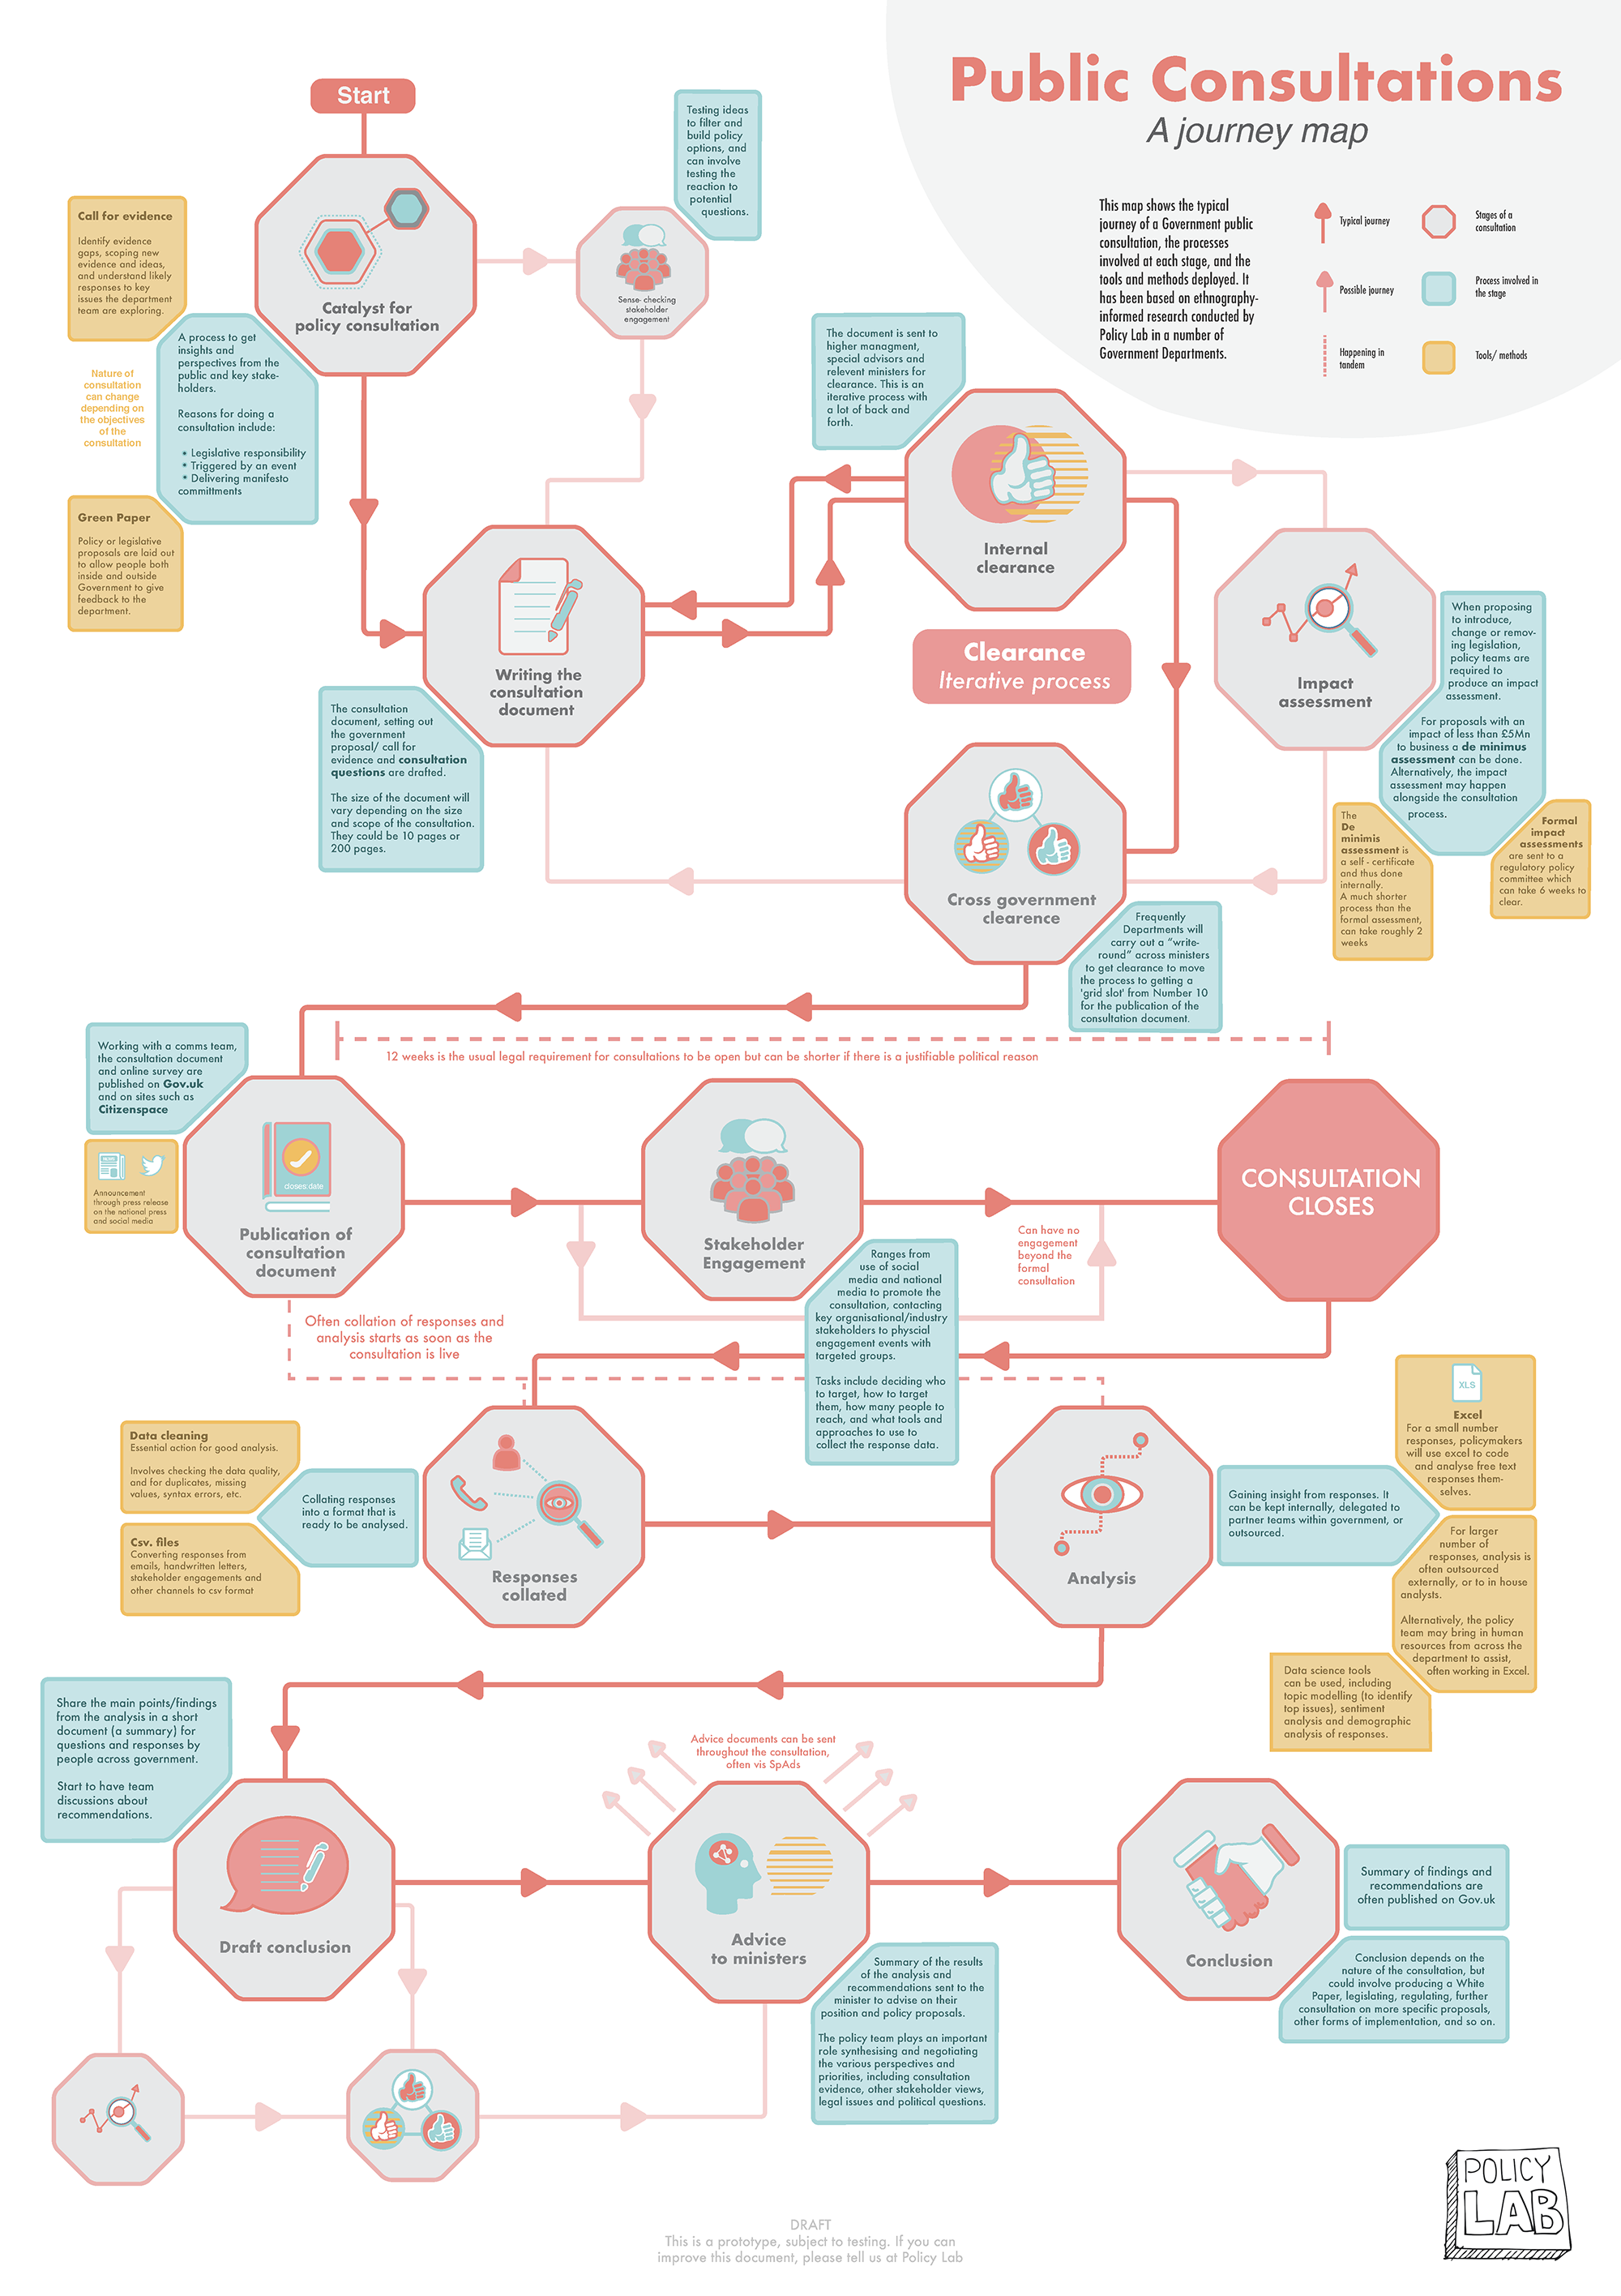
Examples of the most relevant pain points for data science interventions were:
- pressure on resources to do effective analysis of huge volumes of question responses
- difficulties experienced in identifying insights in so much information
- questions about subjectivity, as first answers viewed can influence how we structure subsequent frameworks for analysis
- the sharing of best practice and previous experience could be better, especially to those starting the consultation process
The second part of this two-part blog suggests how data science can address some of these pain points. Whether you are working on data science or not, we hope that the maps shown in this blog can be a valuable resource for all those who may be involved in a policy consultation. Please look over the maps, and let us know if you find them helpful.
2 comments
Comment by Karel posted on
Very interesting read! Would you happen to have a readable version of the image with pain points?
Comment by Matt posted on
Thanks for this - really interesting work. As Karel asked in the comment above (I think - they may have instead been asking for a machine-readable version), it would be great to see a higher-res version of the pain points image.